- Home »
- Insights »
- Global CIO View »
- Macro »
- Small caps ready for a comeback

- European small caps have had a difficult time compared to blue chips. The latter have enjoyed the big price spirals that were once reserved for small caps.
- The big headwind for small caps was the sudden revival in interest rates in 2022. However, expected higher earnings momentum, the record valuation gap to blue chips, stabilising interest rates and reasonable economic growth speak in favor of small caps in the medium term.
- Interest rate cuts or a stronger economic recovery would provide further impetus.
Why small caps have underperformed big caps and how it could change
For almost two years now, small-caps stocks have been driven primarily by interest rate concerns - and rightly so?
Over the past 25 years prices of European small caps have risen by almost 170% while large caps[1] have only gained around 25%. But the period from September 2021 onwards has been frustrating for small-cap investors. Their shares have lagged behind blue chips for almost 550 days - the longest period since the turn of the millennium. They lost almost a fifth of their value, while the blue chips gained around a fifth. As the chart below shows, they have at least stabilized again over the past twelve months. And our medium-term outlook is for a small cap comeback.
Chart 1 The Small Cap Story in one chart: bond yields mattered more than profit forecasts
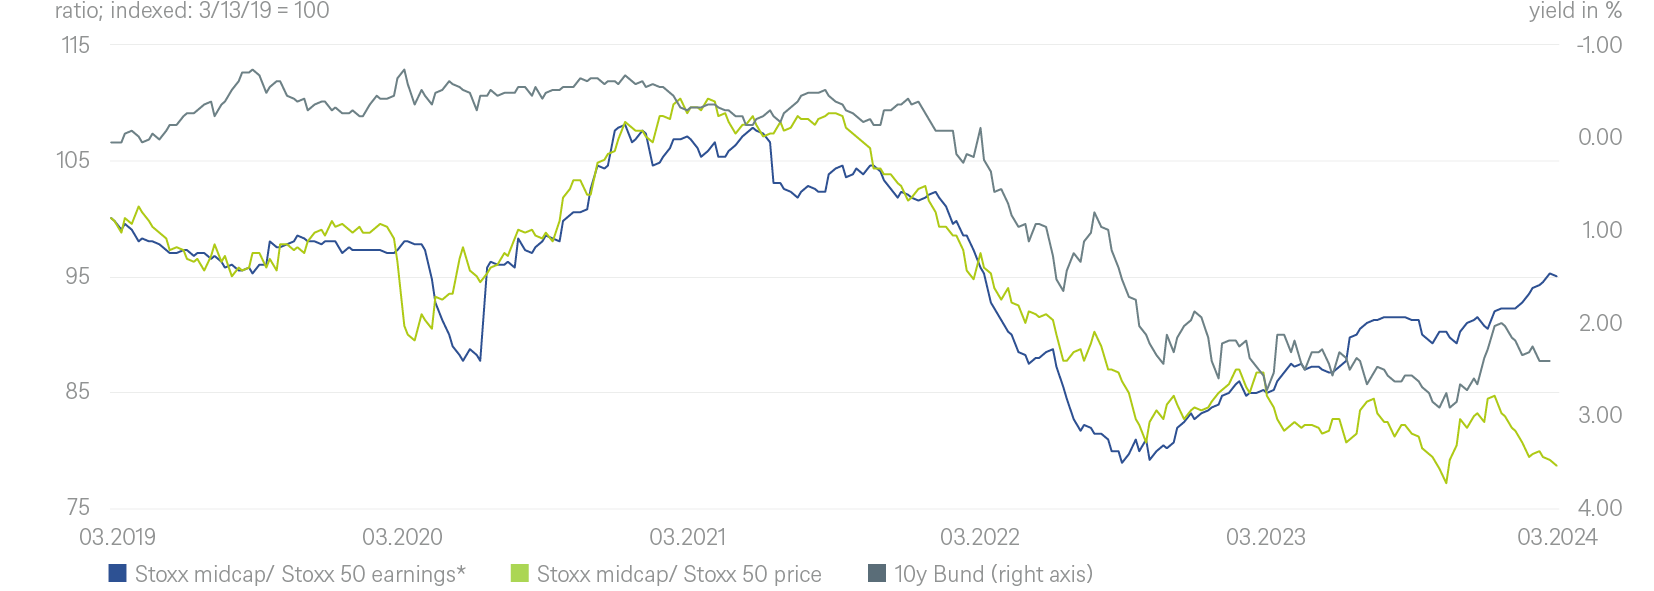
Sources: LSEG Data and Analytics, DWS Investment GmbH as of 3/15/24
Chart 1 shows to a large extent why small & mid-caps[2] have had such a hard time since interest yields started rallying, what is still holding them back and why we have a positive view of them. We would like to emphasize here that we are focusing on the relative view, i.e., the performance of small caps compared to blue chips. In absolute terms we see no reason why small caps should not also perform positively in an overall positive stock market environment. Within our equity universe, we recently downgraded small caps from "Strong Outperform" to "Outperform" from a tactical perspective; our strategic view remains very positive anyway. Should the economy, or at least leading indicators, perform better than expected, or the central banks actually initiate their cycle of interest rate cuts, this would also improve our tactical view again.
The chart can be divided into three periods:
- Until mid-2021 the relative performance of small caps versus blue chips was primarily based on the evolution of earnings estimates in the two indices.
- From mid-2021 to autumn 2022 there was a three-way downward trend: in small caps’ relative price performance and relative earnings estimates, and in interest rates (which rose but are shown inversely in the chart)
- Since autumn 2022 the performance of small-caps stocks has been dependent solely on interest rate trends.
That rising interest rates have hurt small caps may be the most surprising part of this. Small caps are generally considered to be more cyclical than blue chips. Rising interest rates, if they are a reflection of a healthy economy, should therefore not be a disadvantage for small caps. There could be two reasons why they were this time: 1. the European Central Bank’s (ECB) interest rate hikes were due less to a hot economy than to high inflation rates resulting from the distortions of recent years (Covid-19, Ukraine). 2. The market fears that small caps will react more sensitively to higher refinancing costs than blue chips. Relative debt dynamics could help explain this. According to the latest figures from Morgan Stanley,[3] although the ratio of net debt to equity hardly differs (0.35 for blue chips, 0.36 for small caps), the ratio of net debt to EBITDA, which is more directly relevant to earnings, favors blue chips, at 0.99 to 1.2. In addition, it can probably be assumed that larger companies refinance themselves to a much greater extent via bonds than small caps, which are more likely to borrow from banks. The duration of their financial debt is therefore likely to be lower. This means that interest rate increases are likely to have a bigger impact on small caps’ profits than on those of blue chips.
Small caps’ debt probably has lower duration
According to European Central Bank (ECB)[4] data, refinancing costs for the non-financial corporate sector have followed the ECB's interest rate hike path much faster than usual in this cycle. In mid-2022, borrowing costs skyrocketed – and they peaked as recently as October 2023. According to the ECB, 80% of corporate loans have a term of less than one year, and so rising interest rates should be reflected in the profit and loss accounts correspondingly quickly. This is disproportionately the case for small caps, as blue chips are financed to a far greater extent by bonds, which have an average term of five years (in the UK the figure is 9 years). Overall, the global bank HSBC expects that the interest burden on companies will not peak until mid-2025. Here is an interesting comparison: While almost 90% of all Eurozone companies covered by the ECB refinance themselves via bank loans, this figure is only 10% in the U.S. The proportion of financing via bonds is likely to increase in line with the size of the company and the maturity of the business model.
What does this mean for Europe's listed small-caps stocks? It depends on the perspective. We expect 10-year Bund yields to rise slightly over the next twelve months. This means that there is still no tailwind from the interest yield side, though the headwind is easing noticeably. However, it is questionable whether the likely further rise in interest expenses is already adequately reflected in analysts' earnings estimates for small caps.
Double digit EPS-growth expected for small caps – for both 2024 and 2025
This brings us to the relative earnings development in the chart (i.e. the earnings estimates for the next 12 months for the small-caps stocks relative to those for the blue chips). Assuming that they correctly anticipate rising interest costs, the chart is encouraging for small cap stocks. For over a year now, earnings estimates for small caps have been continuously revised upwards, while those for blue chips have at best moved sideways. In concrete figures this means that while the earnings of the Stoxx Midcaps fell more sharply in 2023 (-7.9%) than those of the Stoxx 50 (-3.5%), the consensus expects small caps stocks to gain momentum much faster this year, with earnings growth of 10.2% compared to 3.8% for large caps. Earnings growth of well over 10% is expected for both indices in 2025. Measured in terms of relative earnings growth, a considerable gap has opened up between the performance of blue chips and small caps, as the first chart shows.
Small caps are also lagging behind in terms of the risk premiums on corporate bonds
There is a similar gap in the relative price performance of small cap stocks and the development of risk spreads[5] on high-yield bonds. Since peaking at 575 basis points (bps)in mid-2022, the spread has tightened continuously to 300bps recently. The otherwise close correlation with the prices of small caps stocks has not been evident throughout this period.
The valuation became historically favorable last year. It has become even more so this year
The chart below shows just how cheap small caps have become over the past 20 months, as measured by the price/earnings ratio based on estimated earnings for the following twelve months. Small caps have traded at a premium to blue chips for most of the past 15 years. Quite rightly so, as turnover and profits grew significantly faster on average than for blue chips during this period[6]. However, they are now trading at a discount of almost 10%. There is no hope of a return to the old average, as the sector weightings and characteristics within the indices have shifted too much for that. But even a return to a level without a premium or discount would give the small caps a (relative) boost.
Chart 2 The valuation discount of small caps is below one standard deviation on the 15-year-average
*P/E ratio based on next 12M earnings
Sources: LSEG Data and Analytics, DWS Investment GmbH as of 3/15/24
How can the different opinions be reconciled?
Based on the observations made above, we can state the following. Equity analysts must be very wrong in their earnings estimates and bond investors in their expected returns (which also take into account assumptions about future default rates), for the performance gap between small caps and blue chips not to close again in the medium term. Or are there other reasons why small caps have had such a hard time recently?
What small caps are still struggling with at the moment
Small caps have not been able to avoid the overriding stock market theme of the past few months: the rapid rise of some heavyweights both in the U.S. (in technology) and in Europe (in luxury, pharmaceuticals, consumer goods, and technology). It is a "winner takes it all" investment environment in which the big players are getting bigger and bigger, sometimes at breathtaking speed. Conversely, this means that in the past few years it has not been necessary to invest in small caps in order to have exposure to high growth stocks. It was better, in fact, to invest in the heavyweights. This dynamic is now reflected in the fact that the five largest stocks within the S&P 500 have the highest weighting within the index in history. And many companies have made it into the top ten of the respective index in a remarkably short amount of time: half of the members of the Stoxx 50 Europe (SX5P) have been replaced between 2018 and today. In the S&P 500, four newcomers have pushed out the previous top dogs. Another perspective is to look at the biggest winners and losers over the past twelve months. Looking at the top winners, large and small caps have made similar gains. But looking at the biggest losers, small caps endured much higher losses than large caps – explaining the underperformance of the small cap indices.
The "winner-takes-it-all" syndrome is also reflected in the dominance of the momentum investment style, which has outperformed the market as a whole since last summer. This year alone momentum stocks have gained 18% compared to 7%[7] for the overall market. Bucking the trend as a contrarian has therefore been a thankless investment strategy over the past few months. The last time momentum performed so much better than the market as a whole was at the end of 1999 – which preceded the collapse in dot com stocks. With each passing day that this trend continues, the number of investors seeking to protect themselves against the dangers of this level of concentration is likely to increase.

2 / What else to know about small caps
1.1 Economic environment
Slowly improving economy could gradually become a tailwind
Small caps are generally regarded as being more cyclical than blue chips. Their business models are sometimes younger and they are seen by investors as the riskier alternative because of their lower liquidity on the stock market. In times of crisis, they regularly suffer more than blue chips. But they perform better at the start of a new cycle. After Covid-19 and years of ultra-loose monetary policy, however, determining where we are in the economic cycle has become a tricky job. Certainly, the most recent cycles appear to be far less pronounced than previous ones. And the U.S. and Europe (not to mention emerging markets) are not quite synchronized.
Chart 3 focuses on European leading indicators. But, as small caps also generate a significant proportion of their sales abroad, we also show the global purchasing managers' index (PMI)for the manufacturing sector. The figures can hardly be called exhilarating, which supports our thesis that a weak downturn in Europe and the U.S. will be followed by an equally weak upturn. The headwind eases but only a weak tailwind for small caps.
Chart 3 Stabilizing leading indicators; but not enough strength to hinder rate cuts
Sources: Bloomberg Finance L.P., DWS Investment GmbH as of 3/15/24
Increasing M&A activity is also supportive for small caps
For understandable reasons, small-caps stocks are more often takeover targets than blue chips. This also tends to boost their shares. But in the wake of the rapid interest rate hikes the global takeover business has collapsed. While almost 75,000 transactions totaling USD 6.7 trillion were carried out in the record year of 2021, the figures fell to 52,000 and USD 3.6 trillion in 2023, according to Bloomberg Finance L.P. This year business is expected to pick up significantly as war chests are full, the capital market environment is positive and the economic outlook is stable. Morgan Stanley, for example, expects growth of 50% year-on-year.[8]
1.2 What else to know about small caps
Differing sector weightings can explain some of the differences between the indices
Smaller companies tend to be more cyclical, have higher levels of debt, younger business models, higher beta, and they trade in less liquid stock markets. Another difference between small caps and blue chips is purely coincidental but can nevertheless contribute a great deal to temporary out- or under-performance: the sector weighting of the indices. The Stoxx 600 Midcap versus the Stoxx 50 is shown below as an example.
Chart 4 Quite a difference: sector weights of Stoxx mid cap and Stoxx 50
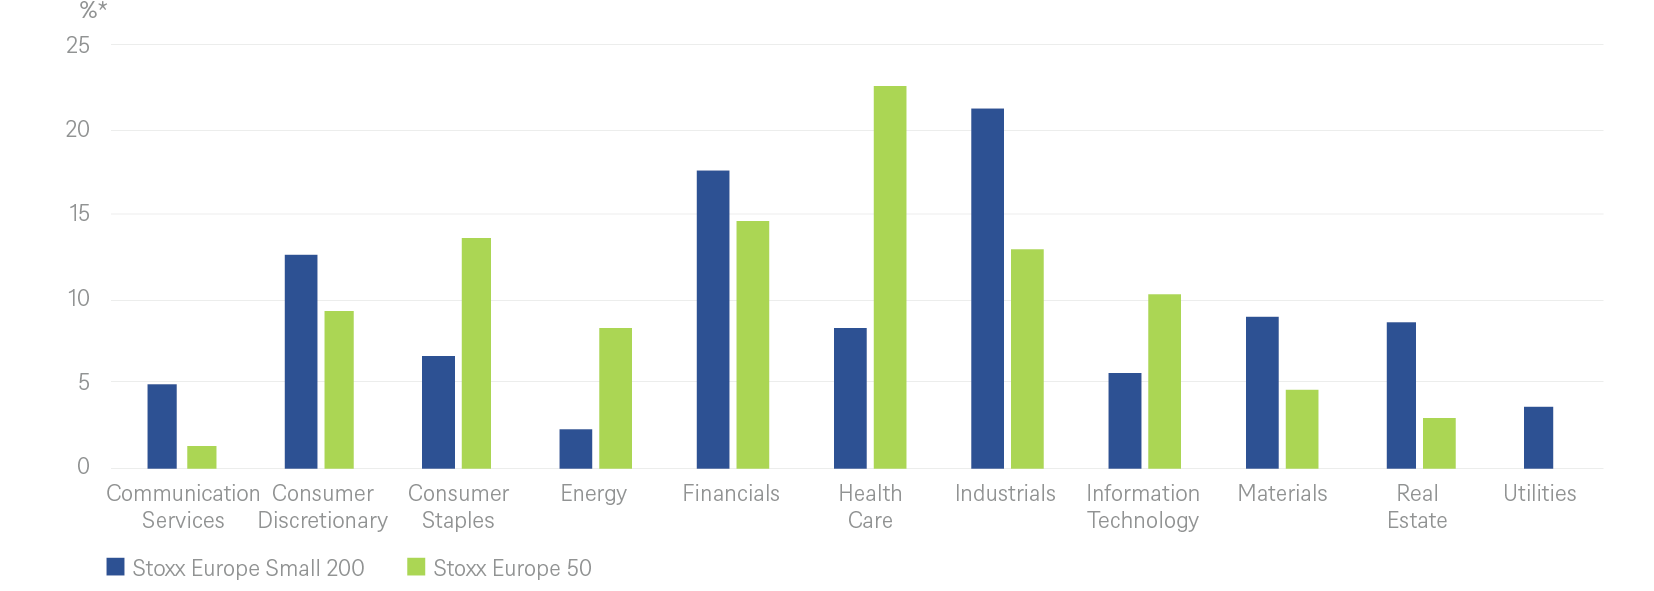
*Market capitalization of sectors in % of total index
Sources: Bloomberg Finance L.P., DWS Investment GmbH as of 3/15/24
Big regional differences in small caps’ relative performance
The big differences in sector weightings shown above may be one reason why small caps perform differently than blue chips in each region.
Chart 5 Big regional differences in small cap’s relative performance to big caps
*small cap index/large cap index
Sources: Bloomberg Finance L.P., DWS Investment GmbH as of 3/15/24


