- Home »
- Insights »
- CIO View »
- Investment Traffic Lights »
- Investment Traffic Lights

- April saw the worst equity and bond markets since last autumn.
- We see sticky (U.S.) inflation, fading Fed rate cut expectations, geopolitical tensions and high equity valuations as a result of the previous rally as main culprit.
- We expect further choppy equity markets, our preferred region remains Europe. We have adjusted some tactical fixed income signals but stay positive for shorter-term U.S. Treasuries.
1 / Market overview
1.1 Geopolitics, delayed rate cuts and slightly positive quarterly reports – turned markets down
April was another rollercoaster month in terms of weather, markets and politics, and the worst for equities and bonds[1] in six months. The month began with an escalation of the conflict in the Middle East, as Iran and Israel entered direct confrontation.[2] This initially increased further the level of global geopolitical risk. But thankfully the confrontation was contained, soothing market fears.
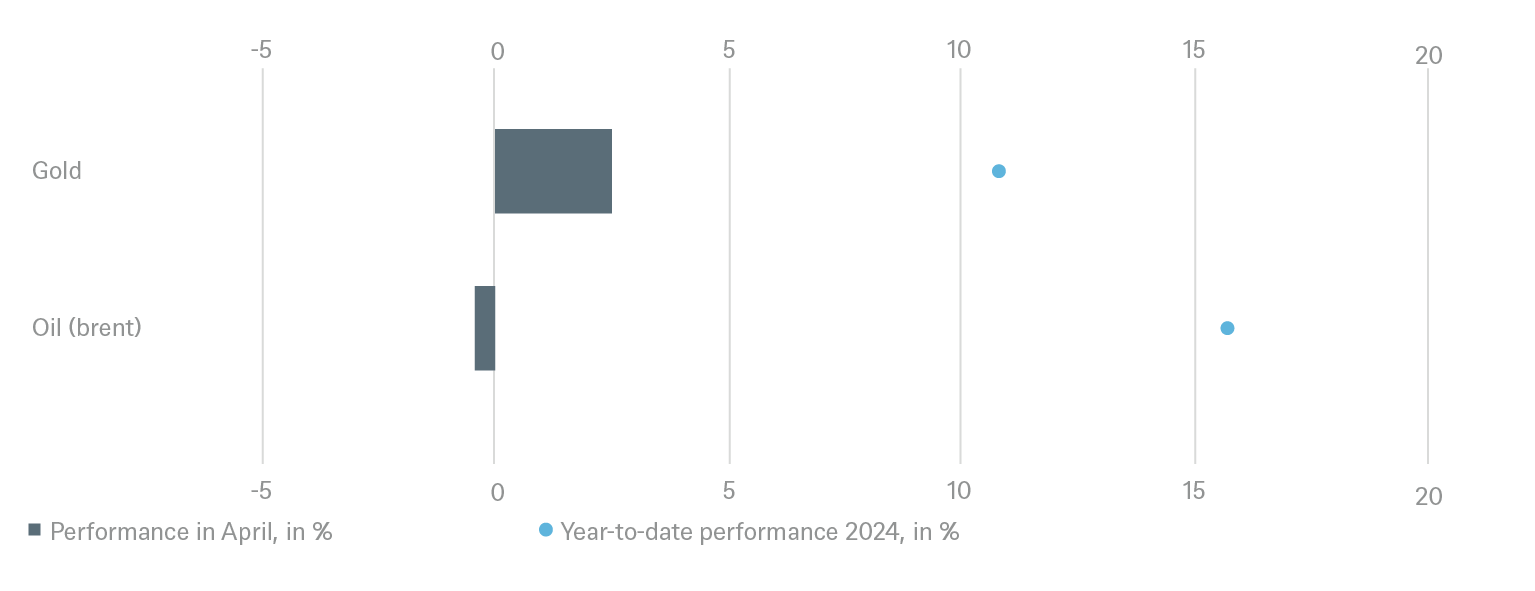
A positive development was that Democrats and Republicans were able to compromise at last and the U.S. Congress finally passed the Ukraine aid package (as well as funds for Israel). Oil and gold are two assets that normally serve as a gauge of geopolitical fears. The oil price stayed elevated until mid-April before falling well below USD 85 per barrel at the beginning of May. Gold behaved similarly, topping USD 2,400/oz at one point, a record, before retreating slightly. Gold’s strength (up 13% since March 1st) might, however, be seen as slightly surprising given that the real yields on 10-year U.S. Treasuries[3] have increased by half a percentage point since the beginning of the year, increasing the opportunity cost of holding gold. Re-ignited inflation fears, heavy buying by China (both by the central bank and retail investors) and possibly fears about ever-increasing public debt levels, not only in the U.S., are the key factors.
Other than geopolitics, inflation remained the main driver for markets in April. There were renewed signs that high inflation might persist, especially in the U.S., and this is pushing out Fed rate cut forecasts. Now only one full cut is predicted by option markets by year-end, compared to five to six cuts earlier this year. The 1Q24 reporting season, on the other hand, has tended to be supportive for equity markets as the figures look overall marginally better than expected so far. And yet most equity indexes lost ground in April. Their rally since November had been strong and made them highly priced and vulnerable. Higher bond yields automatically increase equity valuations by shrinking the Equity Risk Premium.[4]
1.2 MSCI World down 4% and most bond indices in negative territory
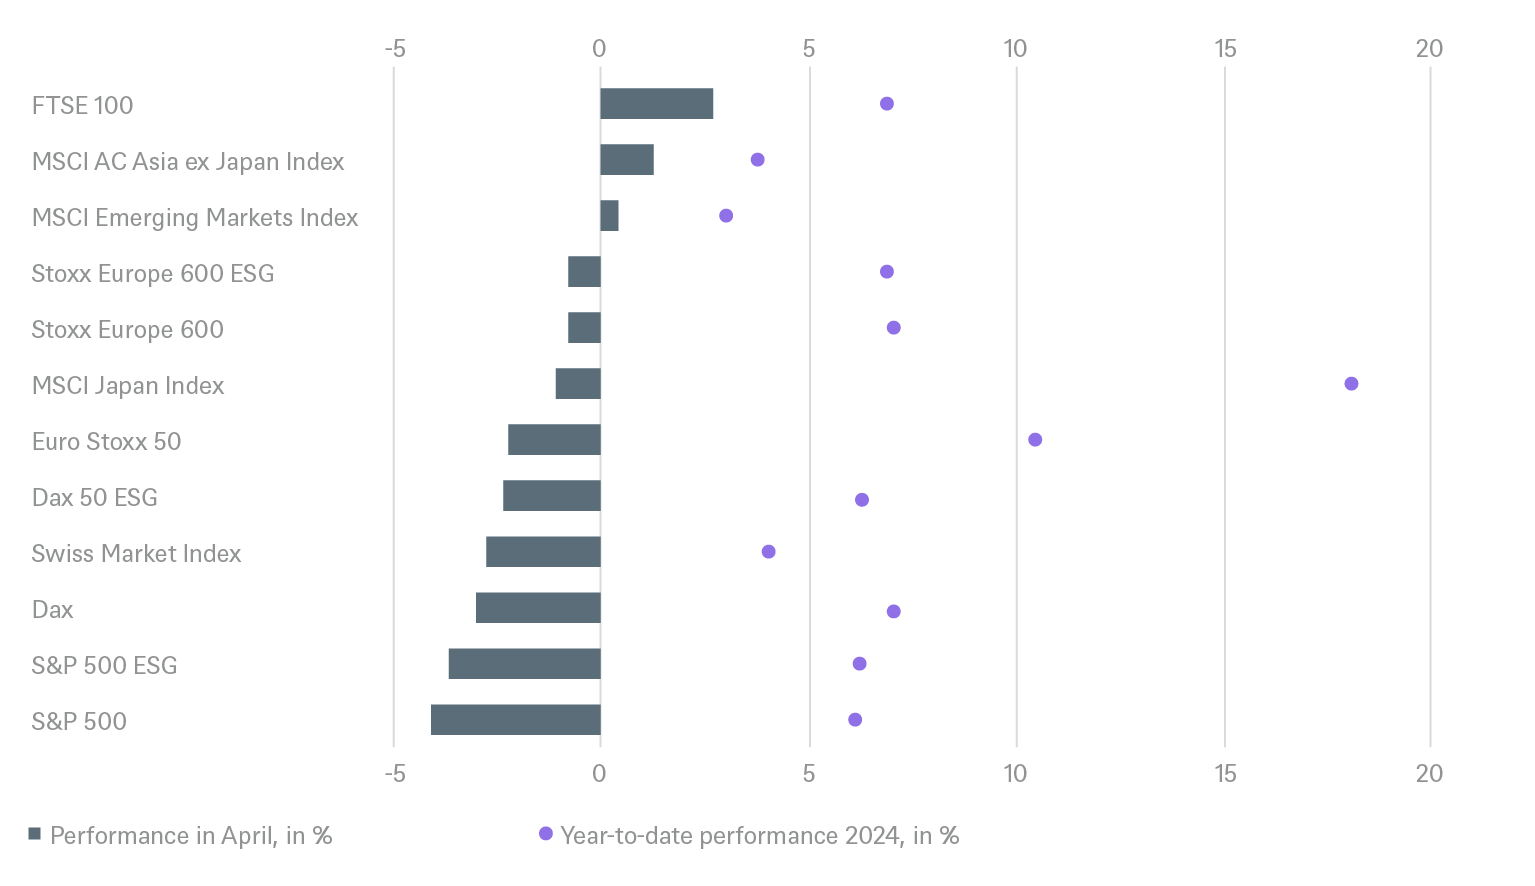
The unlikely pair of equity regions that defied the negative trend and ended April in positive territory were the UK and China. The latter, we believe, benefited from a combination of the historically low relative valuation of Chinese equities compared to U.S. equities as well as stabilizing macro figures and ongoing reform and aid packages by the government. Looking at global markets, the tech sector did worst (-5.5% total return), despite strong quarterly figures; the strength of the prior rally in tech stocks and increasing bond yields proved a toxic mix. In consequence U.S. markets, especially the Nasdaq (-4.4%) were among the worst performers, while Europe held up relatively well (the Stoxx 600 down only 0.8%). Small and mid-cap indices don’t like higher interest yields and had another bad month, with the Stoxx Small Cap index losing 1.3% and the Russell 2000 as much as 7%.
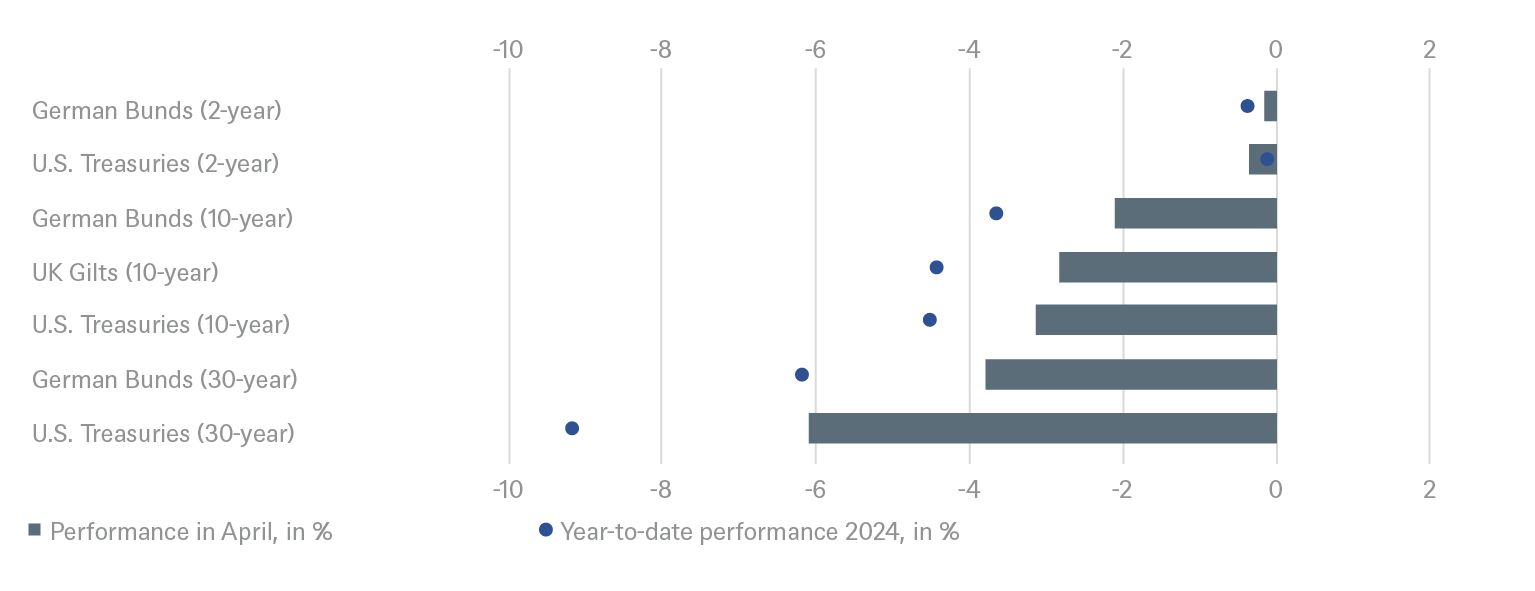
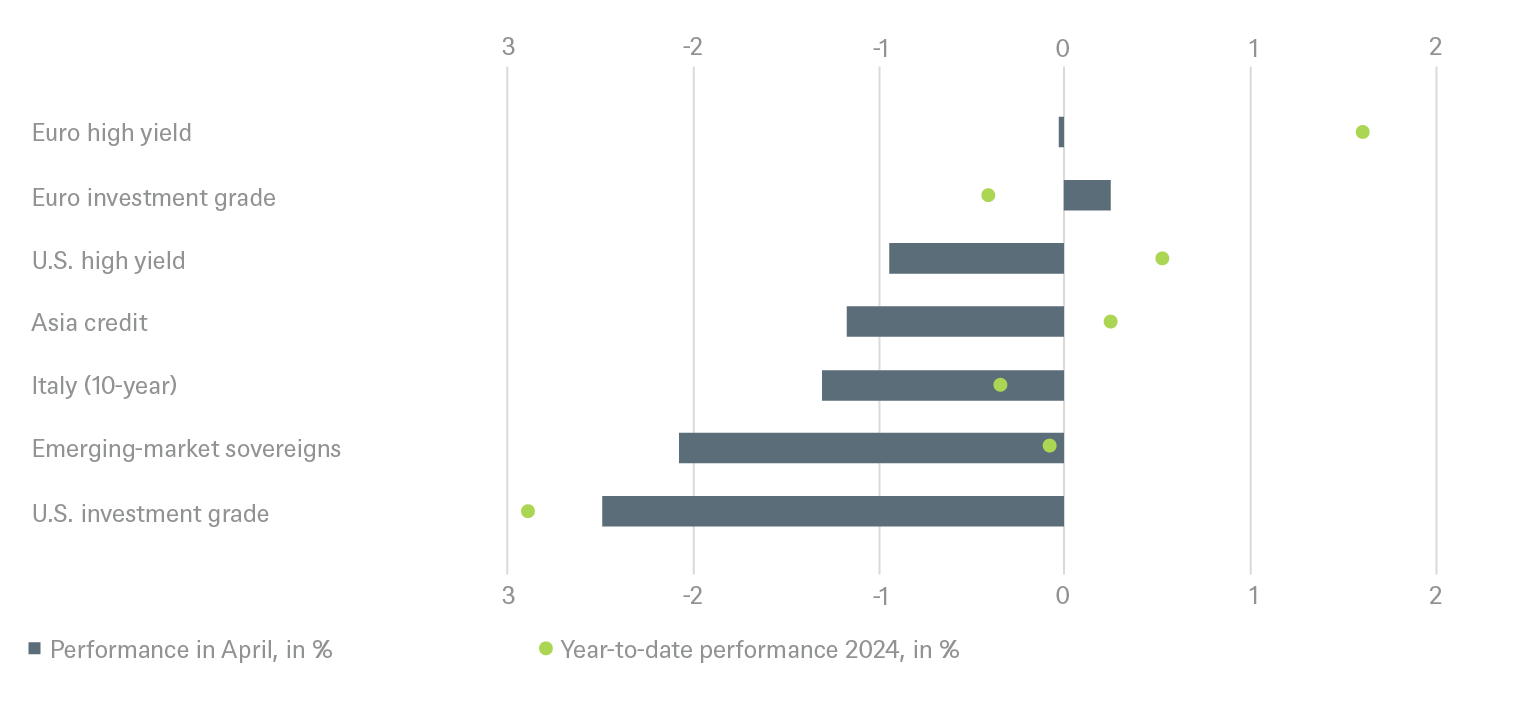
Bonds continued their bad run this year. Two-year U.S. Treasury yields topped 5% and 10yrs topped 4.6% for the first time since November, as markets didn’t like the resilience in U.S. inflation – the March core CPI hit 0.4% month-on-month (m/m). The 10-years Treasury index was down 3.3%. As might be expected, the rising U.S. bond yields also influenced yields and central bank rate cut expectations in other markets. For the European Central Bank (ECB), markets are now pricing in 0.68 basis points (bps) of cuts, compared with 0.89bps at the beginning of the month. And yet the ECB continues to insist on its intention to cut rates while the U.S. Federal Reserve (the Fed) has ceased to give any time schedule. One of the very few segments of the bond market that showed positive returns in April were Euro High Yield bonds. They defied almost all the market‘s nerves despite some high-profile restructuring cases.
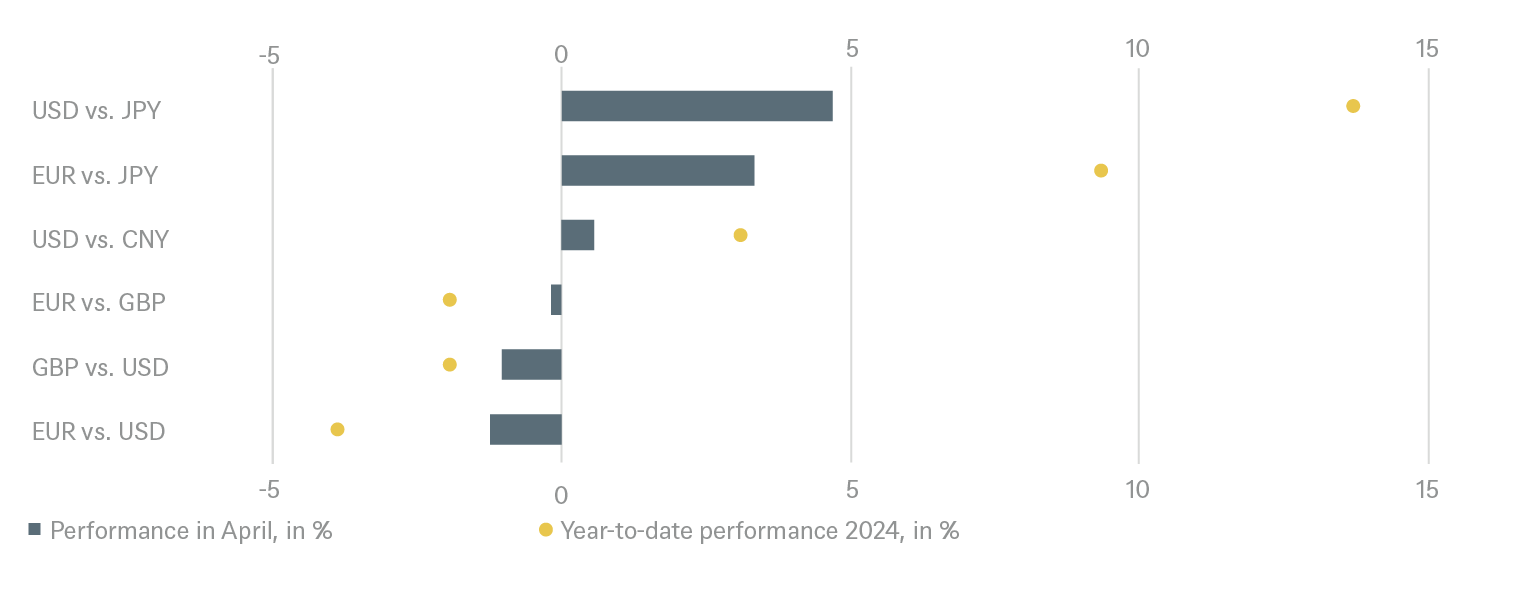
A final word on currencies. The U.S dollar strengthened against a basket of global currencies as it served as a safe haven in uncertain geopolitical times and as U.S. bond yields increased again, widening the yield gap to other countries. Japan's currency was the center of attention as the yen fell below 160 against the dollar. There are strong indications that the Bank of Japan started to intervene on the currency market at the end of the month.

2 / Outlook and changes
The month of May always brings out an old market adage: “Sell in May and go away but remember to return in September.” It goes (almost) without saying that this kind of investment advice might not be the wisest guide to any single year, even if the strategy might have outperformed buy-and-hold on average over past decades. But a number of factors now might well encourage investors to follow the advice of the adage. Many question marks are hanging over markets: Have we seen the peak of geopolitical tensions or could they get worse? Is inflation re-igniting? Are quarterly earnings strong enough to warrant upwards revisions of earnings per share (EPS) forecasts? Will the Fed still cut rates this year? Have we yet even seen the impact of higher rates? How much is the U.S.’s surprisingly strong gross domestic product (GDP) growth dependent on government spending? And when will markets start to get nervous about record high public debt worldwide?
2.1 Fixed Income
Bond yields appear to be reacting to inflation and debt fears. Developed markets’ sovereign bond yields have followed an almost perfect upward path this year and are close to their highs of last fall. This year is not so far “the year of bonds.” But we are not giving up on our forecasts that the the Fed and ECB will tame inflation sufficiently to start the rate cutting cycle this year and start to give bonds some upside.
Government Bonds
U.S. Treasuries: Market expectations have moved from 6 Fed rate cuts in 2024 at the beginning of the year to 1.5 cuts now, because macro data has been very strong in Q1 and inflation has looked far from licked.
Some Federal Open Market Committee (FOMC) members have a hawkish bias and the market has moved much more in line with Fed guidance, pushing back its expectations for the first rate cut to later than summer. We have moved to +1 overweight on 10-year Treasuries while remaining +1 on 2-years and neutral on 30-years.
German Bunds: ECB policymakers have been pointing clearly to a likely rate cut in June 2024. Bund yields, however, have risen since the beginning of the year as expectations of rate cuts, which drove the rally in December 2023, have been put back. Event risks are quite high currently due to increasing geopolitical uncertainties. We are therefore less confident about the front end of the curve and have downgraded 2-year Bunds to neutral while remaining neutral on 10-year & 30-year Bunds.
EU Periphery: We have downgraded our 10-year Italy recommendation to -1 as the spread to Bund yields has seen a significant tightening move in the recent past. Political stability in Italy is good at present and growth modest, though in line with Economic and Monetary Union (EMU) peers. On the negative side, however, the surprising upward correction in Italy’s 2023 budget deficit from 5.3% to 7.2% will not help to convince investors that Italy’s politicians have become more disciplined.
Corporate Bonds
EUR Investment Grade (IG): We return to neutral; the rally that started back in October is losing steam. Credit spreads have moved wider over recent weeks as tension in the Middle East has increased and Fed rate cut expectations have been pushed back.
EUR High Yield (HY): We remain negative tactically. The market has become more volatile mainly due to idiosyncratic credit events at some larger issuers. However, contagion has been limited so far we see no need yet to adjust our default rate assumptions (2.5-3%) for this segment. The cash market continues to be supported by strong technicals.
U.S. IG: Here we also remain negative as the U.S. IG Credit index is trading close to its tightest this year despite Treasury yields moving 35-45 basis points (bps) higher across the curve in a few weeks. This illustrates how strong the technicals are although inflows have declined recently. This is a technical call as we believe that in the short term the bonds are priced for perfection and thus susceptible to negative headline news. On a 12-month basis we still believe inflows and attractive yields will support the asset class.
U.S. HY: Given that spreads have already widened for HY, we are Neutral on this segment.
Emerging Markets (EM)
EM Sovereign: We moved to -1 when spreads moved to their tightest in 5 years, on 11 April. Markets may remain under pressure tactically given regional geopolitical tensions.
Asia Credit: Asian credit spreads have continued to grind tighter this year. First quarter earnings from Asian corporates have so far been encouraging. This has been one of the drivers of better sentiment, with a low level of new issuance another factor. The market still expects net debt redemptions in 2024. We keep Asia Credit at +1, but with a cautious stance given geopolitical uncertainty.
Currencies
Strong U.S. economic data and the retiming of Fed rate cut expectations has driven the dollar higher. This trend is expected to continue for some time. But some Asian countries have shown their unease about the strong dollar and intervention is possible. We have closed the short EUR vs USD position. We upgraded USDCNY to +1 after weak Q1 economic data for China, with weaker exports and capital outflows. In addition, current geopolitical trends are not in favor of the CNY.
2.2 Equities
Following five months in which equity markets have risen without interruption, April saw an overdue mini-correction, triggered by geopolitical tensions and a too hot U.S. economy. Following the release of higher than forecast inflation data, equity investors had to push out expectations for the first Fed rate cut, probably until September. The resulting 40bp uptick in the U.S. 10-year yield has stretched U.S. valuation levels even further. The S&P 500 equity risk premium is now down to levels last seen in the mid-to late 1990s. Stretched U.S. valuations plus rising election uncertainty are two powerful arguments that make a trading range for the S&P 500 of 4,700-5,000 until November look a plausible scenario to us – slightly below current levels.
On the other hand, Q1 corporate results are so far arguing for a more constructive view of the market. Large tech companies are announcing new multi-billion-dollar investment in data centers. These investments give additional credibility to the view that Artificial Intelligence (AI) could trigger productivity gains across the economy. Furthermore, we have seen early signs from industrial and chemical companies that the destocking cycle has come to an end. We therefore continue to expect 4% (Europe) and 8% (US) EPS growth. Our regional preference continues to be for Europe (outperform) as valuation levels are less stretched. Overall, optimists may argue that any correction will be short-lived as long as the macro picture remains stable and earnings keep growing.
U.S. Market
As mentioned above the 1Q24 reporting season is so far going well for U.S. corporates, especially the IT sector. Most of the so-called Magnificent 7 have had good results, exceeding market expectations on earnings. But the prior rally, the higher-for-longer interest rate environment and election nerves are keeping us cautious on the U.S.
European Market
Europe remains our preferred market as the macroeconomic data is improving further while the market is still trading at near-record high valuation discounts to the U.S. Additionally, it has now become market consensus that the ECB will cut rates ahead of the Fed, boding well for valuations.
German Market
The German market is not much different to the European market but is fighting additional headwinds, such as expensive energy supply and a less favorable sector mix. We are Neutral but are keeping an eye on improving sentiment.
Emerging Markets
The strong dollar and higher U.S. yields are no help to this region. It has seen further fund outflows in April and our position is neutral.
Chinese economic data is not spreading optimism and government support programs only suffice to stabilize the status quo. Cheap valuations are not so much a support as a value trap because investors are pulling money out of China with a “global emerging market index without China strategy” (GEM-ex China) a talking point. We prefer exposure to consumer and tech names for structural reasons. In India the higher oil price is not proving a stumbling block and elections are expected to deliver a market friendly outcome. India continues to be attractive from a top-down perspective and is the second largest GEM market now. Its valuations in general are not supportive, but financials are somewhat better and our preferred exposure.
Japan
We downgraded Japan in mid-March tactically on the back of the previous strong performance of the market and as event risk increases; it is becoming more likely that the Bank of Japan (BoJ) will intervene to support the weak yen.
Sectors
Communication services and Consumer Discretionary remain our preferred areas for fresh investments.
We like Communication Services (outperform), especially the North American Media & Entertainment sub-sector. We prefer Communications over IT as we see similar 18-20% EPS growth but lower valuations (Price to Earnings 2025 16x vs 21x). We have changed our view on the European telecom sub-sector from “outperform” to “underperform,” as the pricing power of telco service providers is fading.
We remain focused on Asian semiconductors as the key beneficiaries of AI and the ongoing rise in the use of silicon in cars and manufacturing. We stick to our outperform call on U.S. software which has so far lagged behind the overall sector performance.
We stick to the outperform rating on consumer discretionary stocks. Despite falling real wages, we expect robust consumption trends to be supported by low unemployment rates.
The consumer staples sector (neutral) has continued to underperform. As a result, the sector’s typical valuation premium has disappeared. We notice that several brands that attract low-income consumers seem to be suffering from weak demand. We believe that the valuation levels of beverage companies (we prefer beer over spirits) are particularly attractive and highlight the household & personal products sub-industry as a defensive investment opportunity.
Utilities (neutral) remain an area of intense debate with strong pros and cons. As a subsector we like regulated utilities.
We rate global financials neutral. Cash returns in the form of dividends and buy-backs remain a key attraction, especially of banks. We focus on European and Nordic banks while avoiding the artificially high valuation of some Australian names. Bad debt provisioning has increased somewhat from depressed levels but remains well under control in our economic base case scenario.
The global listed real estate sector (neutral) is suffering as mortgage interest rates remain high. In addition, the negative news flow from U.S commercial real estate has not stopped yet.
The global industrials sector has a selection of quite diverse business models. We remain neutral due to its 10% market premium valuation. However, fundamentals seem to be improving, with companies exposed to the early stages of the business cycle seeing improving order income and an end to inventory destocking. We stick to our long-held overweight of the Aerospace and Defense sub-sector but highlight that European defense stocks might have become too expensive.
The energy sector has seen a strong rebound recently, making it the best performing sector YTD. We remain neutral. Our view is that despite a global energy transition, significant investments in technology and drilling will continue. We are therefore sticking to the overweights on energy equipment & services and integrated oil majors. A high level of spare capacity within the OPEC prevents us upgrading the sector.
Within Materials (neutral) we like four sub-sectors. Our sector team views gold miners as an attractive play on the higher gold price. So far, investments into gold bullion have been the better investment, as margins in gold mines have been squeezed by higher mining costs. Our analysts see initial signals that this has turned for the better. Industrial gases are the largest sub-sector with attractive defensive growth characteristics. Commodity chemical stocks should benefit if the first green shoots seen during the past weeks continue, with clients ordering more volume.
Finally, we remain neutral on health care. While health care reform is not high on the agenda in the U.S. election campaign, we suspect that managed care could be impacted most. In biotech, the lack of initial public offerings (IPOs) and secondary equity financing is hurting the industry and might start pressuring life science tools companies as well.
2.3 Alternatives
Gold
The latest retrenchment in gold and silver prices is consistent with reduced expectations of early Fed rate cuts. The trend is reminiscent of gold price movement in April2022, and April / May 2023, when the market’s rate expectations also shifted significantly. We expect physical gold demand from both central banks and individual buyers in Asia and elsewhere to remain robust. We also expect investor demand to return to gold when there is more clarity on the direction of rates from the Fed.
Oil
After market participants reduced their expectations on immediate geopolitical risk from the Iran and Israel conflict, the attention of market participants has reverted back to supply and demand expectations. The extension of sanctions on Iran’s oil sector to include oil ports, vessels, and refineries is unlikely to cause significant supply disruption; the market expects the enforcement impact to be limited, as has been the case with Russian sanctions. While it is still premature to assume that geopolitical tensions are past their worst it does seem we may be at a pause here and Brent bounced back down from the USD 90/barrel threshold several times in April. Fundamentals still point to a slow grind higher.
3 / Past performance of major financial assets
Total return of major financial assets year-to-date and past month
Past performance is not indicative of future returns.
Sources: Bloomberg Finance L.P., DWS Investment GmbH as of 4/30/24
4 / Tactical and strategic signals
The following exhibit depicts our short-term and long-term positioning.
4.1 Fixed Income
Rates |
1 to 3 months |
through Mar 2025 |
|---|---|---|
| U.S. Treasuries (2-year) | ||
| U.S. Treasuries (10-year) | ||
| U.S. Treasuries (30-year) | ||
| German Bunds (2-year) | ||
| German Bunds (10-year) | ||
| German Bunds (30-year) | ||
| UK Gilts (10-year) | ||
| Japanese government bonds (2-year) | ||
| Japanese government bonds (10-year) |
Spreads |
1 to 3 months |
through Mar 2025 |
|---|---|---|
| Italy (10-year)[5] | ||
| U.S. investment grade | ||
| U.S. high yield | ||
| Euro investment grade[5] | ||
| Euro high yield[5] | ||
| Asia credit | ||
| Emerging-market sovereigns |
Securitized / specialties |
1 to 3 months |
through Mar 2025 |
|---|---|---|
| Covered bonds[5] | ||
| U.S. municipal bonds | ||
| U.S. mortgage-backed securities |
Currencies |
1 to 3 months |
through Mar 2025 |
|---|---|---|
| EUR vs. USD | ||
| USD vs. JPY | ||
| EUR vs. JPY | ||
| EUR vs. GBP | ||
| GBP vs. USD | ||
| USD vs. CNY |
4.2 Equity
Regions |
1 to 3 months[6] |
through Mar 2025 |
|---|---|---|
| United States[7] | ||
| Europe[8] | ||
| Eurozone[9] | ||
| Germany[10] | ||
| Switzerland[11] | ||
| United Kingdom (UK)[12] | ||
| Emerging markets[13] | ||
| Asia ex Japan[14] | ||
| Japan[15] |
Style |
1 to 3 months |
|
|---|---|---|
| U.S. small caps[26] | ||
| European small caps[27] |
4.4 Legend
Tactical view (1 to 3 months)
The focus of our tactical view for fixed income is on trends in bond prices.Positive view
Neutral view
Negative view
Strategic view through March 2025
- The focus of our strategic view for sovereign bonds is on bond prices.
- For corporates, securitized/specialties and emerging-market bonds in U.S. dollars, the signals depict the option-adjusted spread over U.S. Treasuries. For bonds denominated in euros, the illustration depicts the spread in comparison with German Bunds. Both spread and sovereign-bond-yield trends influence the bond value. For investors seeking to profit only from spread trends, a hedge against changing interest rates may be a consideration.
- The colors illustrate the return opportunities for long-only investors.
Limited return opportunity as well as downside risk
Negative return potential for long-only investors


